
Report Generation Automation
A solution that automatically generates comprehensive reports using AI to analyze user data entered periodically, including graphing, evaluation, prediction, and text expression.
Background
- Designing/developing a solution that performs all the following is not straightforward:
- Algorithm/solution for expressing data as graphs
- Algorithm/solution for comparing and analyzing past and present data
- Algorithm/solution for making comprehensive evaluations based on data
- Algorithm/solution for predicting future values from data analysis
- Algorithm/solution for expressing data analysis results in text
- We determined these features could be developed faster and easier with better performance using generative AI including LLM solutions
- We judged cost-efficient implementation and results could be achieved with appropriate Prompt Engineering and caching
Project Description
Users periodically entered personal data for several items:
- While the total types of items users could enter were defined, which items were entered varied by situation each time
- Continuous and discontinuous data were mixed
In this situation:
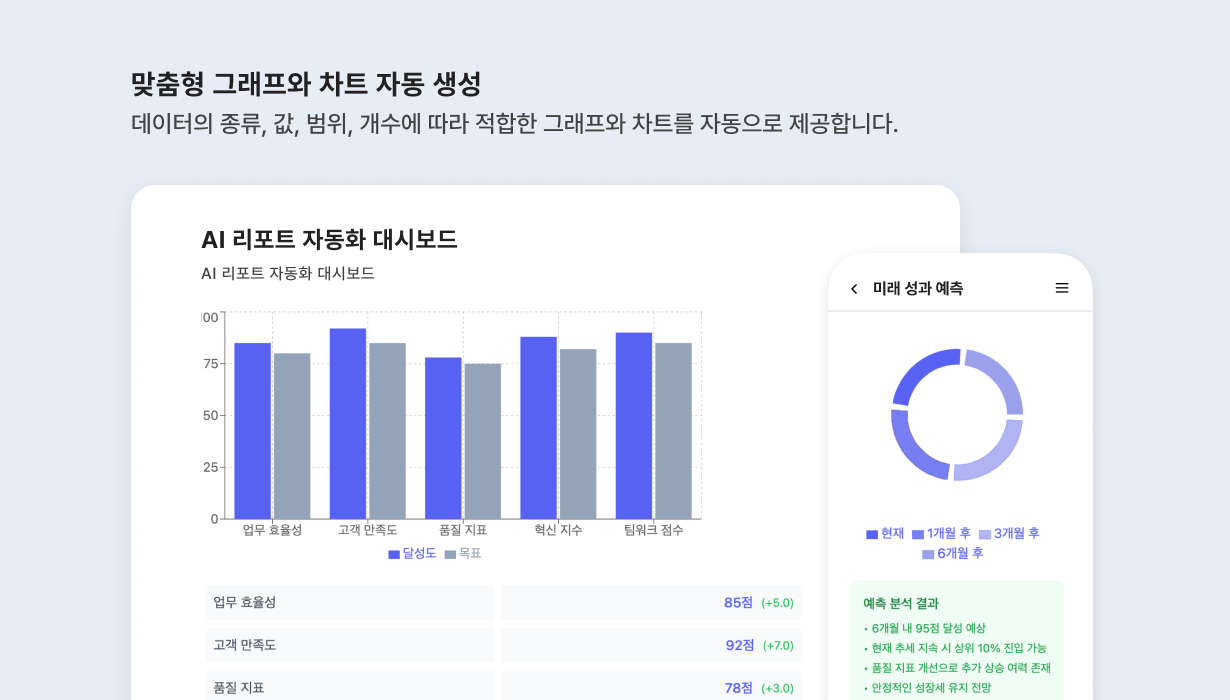
- Data Analysis: Analyzed data entry presence, entered data values, data changes, and trends
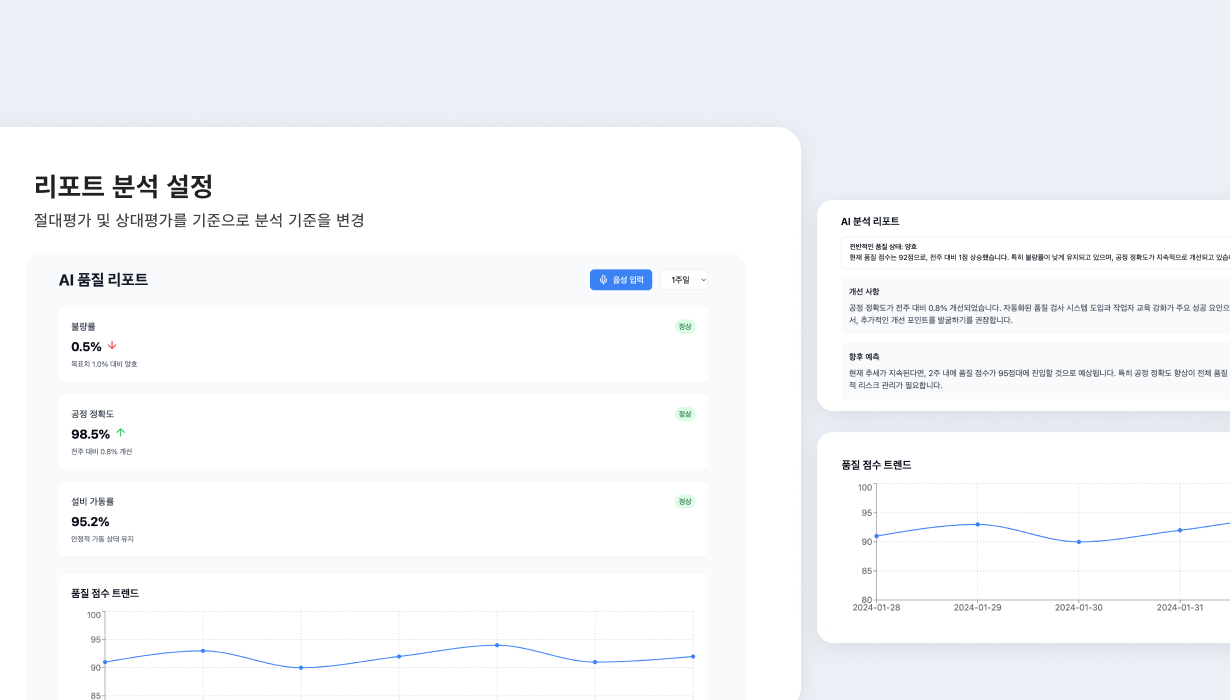
- Evaluation and Scoring: Made judgments (Good or Bad) about users based on analysis results and expressed the degree as numerical scores
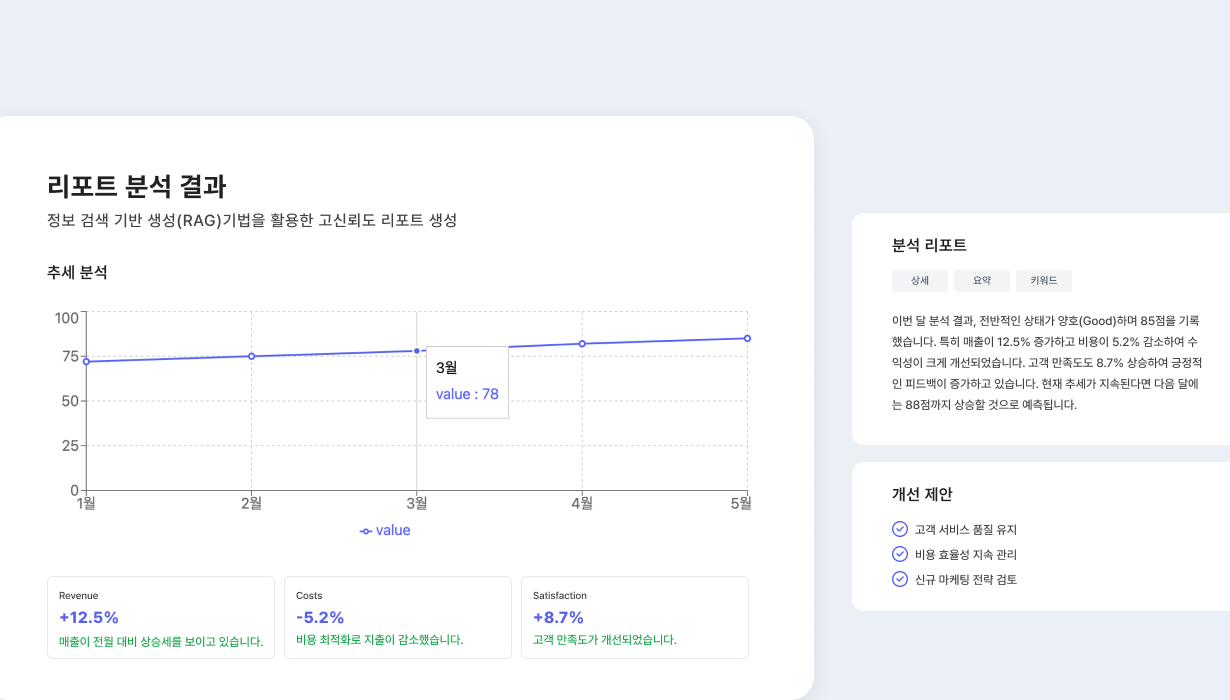
- Text Expression: Beyond expressing analysis scores, presented data analysis content in user-friendly wording for easy understanding
- Prediction Data: Provided not only data-based analysis results but also future prediction data
Key Achievements
- Completed all algorithms for expressing data as graphs, comparing past/present, comprehensively analyzing and evaluating, predicting future, and expressing results in text within 1 month with high quality. Considering 2-3 months development time if done separately, reduced development resources by approximately 50-60%
- Using generative AI, data analysis results could be expressed in "easy to read, easy to understand sentence" format. Core summaries were also easily achievable. This improved readability and communication for users, significantly increasing data analysis report satisfaction
- Could flexibly accommodate slight changes in report data types, content, and format and immediately reflect them in analysis. If features were implemented separately using traditional methods, additional development resources would have been needed to respond to such changes
Development Process
- Step 1: Service Requirements Definition
- Defined analysis target data types and formats
- Confirmed analysis items to include in reports
- Step 2: Data Analysis Design
- Designed continuous/discontinuous data processing approaches
- Defined evaluation criteria and scoring methods
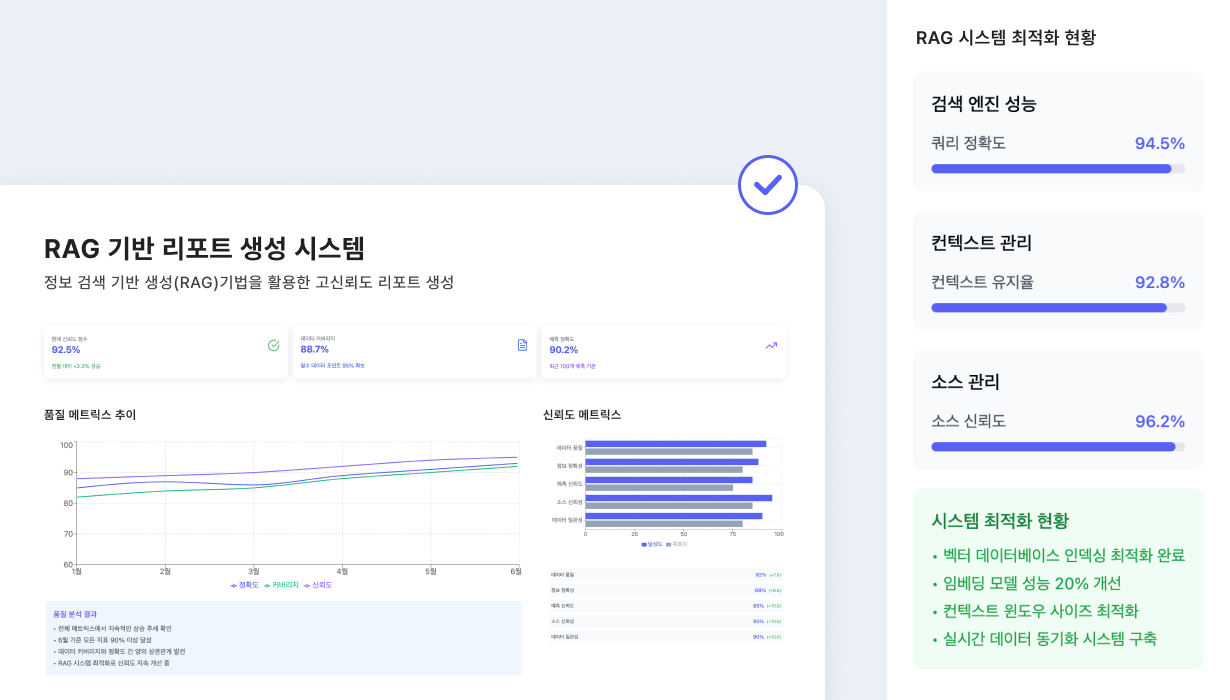
- Step 3: AI Solution Architecture Design
- Selected LLM models (Claude, OpenAI)
- Established Prompt Engineering strategy
- Cost optimization through caching strategy
- Step 4: Visualization and Report Template Development
- Developed graph/chart generation modules
- Designed report layouts
- Step 5: Backend System Development
- Node.js, SpringBoot-based API development
- MongoDB, VectorDB integration
- Step 6: Commercialization and Feedback Collection
- Real user testing and feedback collection
- Report quality improvement
Our Strengths
- Development company with 10+ years of experience
- Data/algorithm experts (Seoul National University ECE Bachelor's/Master's graduates)
- Rich experience developing/commercializing hospital/patient data analysis services like 'PatientTree', operated as paid services in 100+ hospitals providing hospital-specific analysis data and reports
- Wishket Top 0.1% PRIME Partner certified
- Extensive experience conducting data analysis using multiple AI solutions